Pump Curves vs. System Curves: Why Both Matter in Sizing
Pump curves show what a pump can do; system curves show what your piping demands. Overlaying the two reveals the true operating point—flow and head where your system will actually run. Get this right, and you’ll avoid short-cycling, cavitation, and wasted energy.
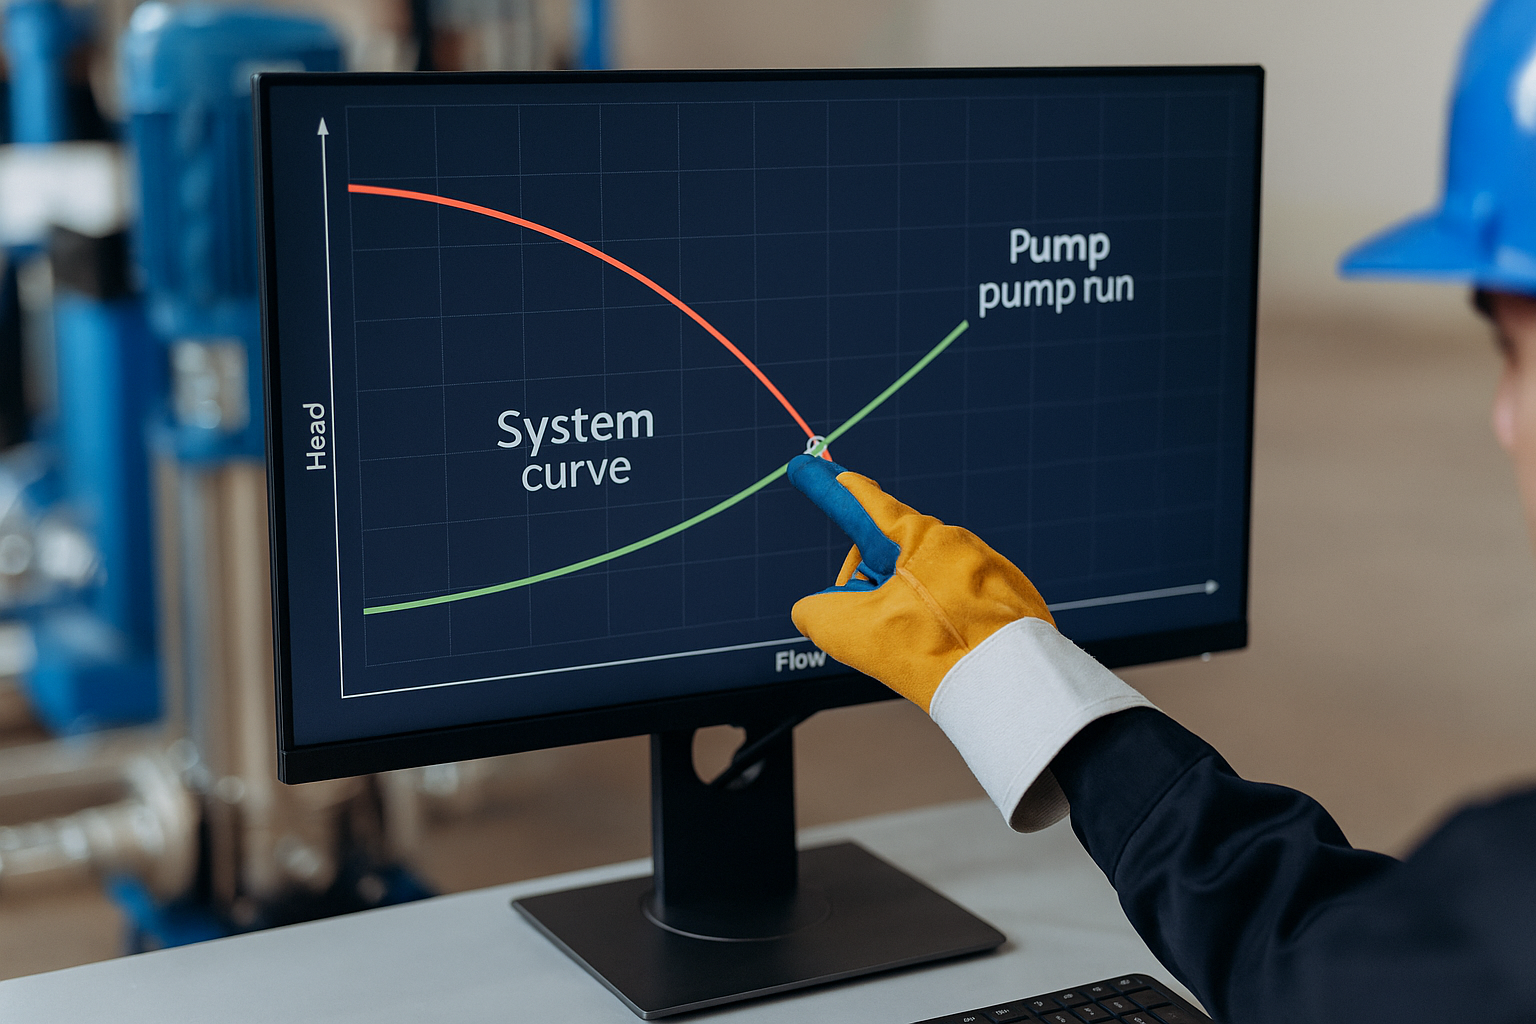
Curve Overlay: Operating Point
Reading a pump curve
A pump curve plots head vs. flow. Each impeller diameter has its own curve; efficiency “islands” overlay the chart. For variable-speed systems, imagine a family of curves—slower speeds shift the curve “down and left.” Check the operating window, shutoff head, and maximum flow. See pump sizing basics and common impellers.
Building a system curve
The system curve reflects what your piping demands. Start with static head (elevation change), then add friction loss for pipe, fittings, and valves. Friction rises with the square of flow, which is why the curve bends upward. Use real pipe sizes/lengths and fittings.
Finding the operating point
Overlay the pump and system curves. Their intersection is the operating point. If it lands off the efficiency island, consider a different impeller diameter, a different pump style (e.g., vertical multistage vs. end suction), or variable speed control. Throttling valves move the system curve; VFDs move the pump curve family.
Efficiency and NPSH
- Efficiency: Higher efficiency reduces energy cost and heat. Avoid operating far to the left of BEP (best efficiency point) to limit vibration and radial load.
- NPSH: Compare available vs. required. Low NPSHa risks cavitation—raise suction head, reduce temperature, or lower flow to increase margin.
Real-world tuning tips
- Balance valves before curves: Set distribution first, then verify the operating point.
- Log baseline data: Amps, pressure, and flow at handover—track drift over time.
- Use VFD limits: Set min/max Hz so you stay within curve and motor cooling envelope.
- Plan for fouling: Expect friction to rise—leave headroom or enable pressure-tracking control.
Frequently Asked Questions
What shifts a system curve?
Valve position, pipe diameter/length, and fouling change friction. Closing a valve or adding fouling steepens the curve; larger pipe or cleaned strainers flatten it.
Why does efficiency matter?
Running near BEP lowers power draw and mechanical stress, improving reliability and reducing lifecycle cost.


